The DepView tool originated from a small assignment in a program analysis course, inspired by my habit of reading other people’s code. For example, a while ago, I got the source code for my senior’s project, which consisted of 100 Java files and 11k lines of code. How does one understand a project’s code? Our first thought is to understand it by reading documentation and comments, but my senior’s project clearly had neither. Alternatively, I could ask my senior directly, but he might not remember his thought process when he wrote the code months ago. Thus, in many cases, the only way we can understand a project is by directly reading the code, precisely what is called “Read the fucking source code.” So, could there be a tool to assist me in understanding code?
Key Points for Understanding a Project
What key information can help us understand code well?
The first type of key information is the basic usage patterns of the code, or use cases. Through use cases, we can quickly identify which modules are external interfaces, and these modules should be our primary focus. If a project has well-written test code, then by looking at the test cases, one can quickly understand the code’s usage patterns.
The second type of key information is the collaborative relationships between modules. Often, program logic is scattered across different modules, making it difficult to untangle. If one can understand the interrelationships between modules, it becomes much easier to sort out the program’s structure. This can be achieved with a tool. I hoped for a tool that could display dependencies between modules, including: finding program entry points (module entry points) and identifying closely collaborating modules. Depview implements the analysis and display of call dependencies. This is because call dependencies are easy to define and can effectively represent the relationships between upper and lower-level modules.
Workflow
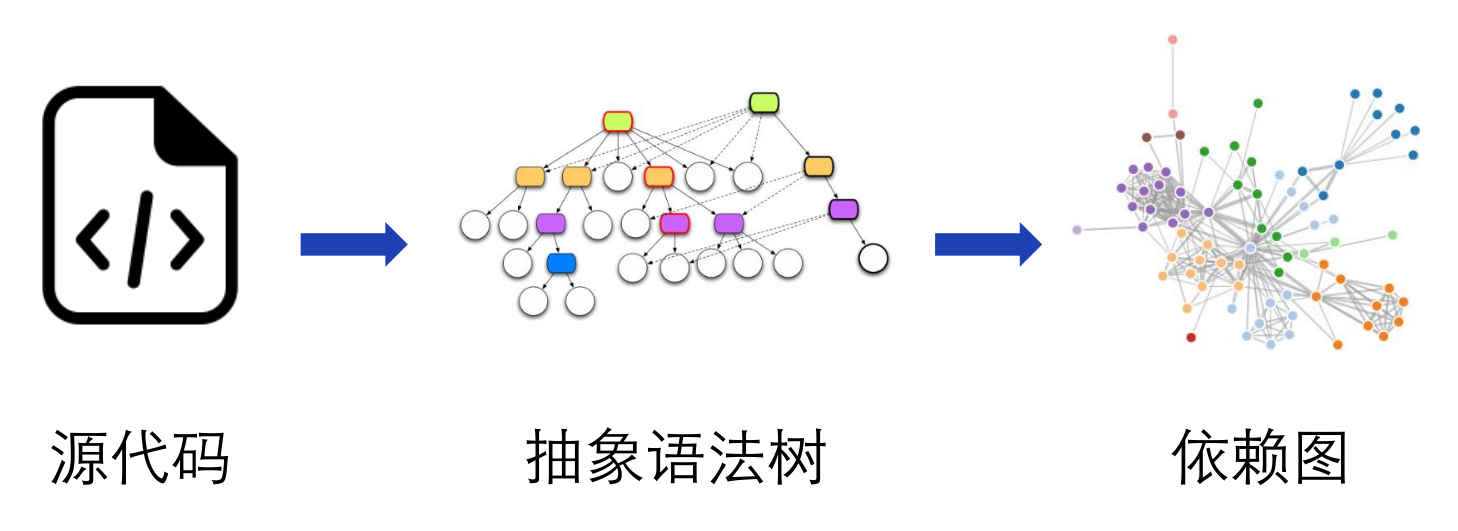
Depview’s workflow can be divided into two parts: analysis and display. It first parses the source code to generate an abstract syntax tree, extracts dependencies from the abstract syntax tree, and finally draws the dependency graph.
Input
Depview analyzes Java projects. For analysis purposes, it requires both the Java project’s source code and compiled bytecode. Since Java projects often have numerous dependencies, users can also include dependencies in the analysis as needed. For convenient input, Depview supports a description file where users can specify the Java project’s source code, bytecode, and related dependencies. The description file uses the HOCON format, which is similar to JSON but more readable and writable. An example description file is shown below; most paths support project-relative paths, and dependencies support both Jar dependencies and Maven dependencies. Depview will copy the corresponding Jar files from the local Maven repository.
testSubject {
    name = DepView
    package = me.nettee.depview
    path {
        base = /home/william/projects/depview
        sources = [ src/main/java ]
        classes = [ target/classes ]
    }
    dependency.jar = [
        libs/fastjson-1.2.16.jar
        libs/guava-19.0.jar
    ]
    dependency.maven {
        repository = /home/william/.m2/repository
        jar = [
            config-1.3.1.jar
            commons-lang3-3.7.jar
        ]
    }
}
Parsing
Depview uses the Eclipse JDT tool to parse Java code into an abstract syntax tree. It primarily utilizes ASTParser, ASTNode, and ASTVisitor related APIs; refer to the Eclipse JDT documentation. This tool requires both a source path and a class path, where the class path includes the project’s bytecode and dependency libraries.
I had used the Eclipse JDT tool several years ago, but at that time, I didn’t know about Maven and didn’t understand the importance of dependency management tools. I used to copy JAR files from the Eclipse installation directory into my projects as dependencies. Furthermore, it wasn’t clear which Maven dependencies the Eclipse JDT tool actually required. It wasn’t until I worked on a project comparing AST similarity that I referred to this blog post to determine the Maven dependencies. It turned out that using Maven for management is incredibly convenient and helped me avoid a major pitfall in this project. More on that later.
Extracting Dependencies
Depview extracts call dependencies by traversing all abstract syntax trees. Traversal can be done by inheriting the ASTVisitor class and using the Visitor pattern to traverse the abstract syntax tree.
A call dependency consists of three elements: the source class, the target class, and the call expression. First, the traversal starts from each class definition (TypeDeclaration) node. All call dependencies under this node have this class as their source. During traversal, method invocation (MethodInvocation) nodes are sought. Method invocations generally take the form expression.ID(args), and the type name of expression is extracted as the target class.
Extracting the type of expression requires using JDT’s binding feature. During testing, I found that JDT could not obtain bindings for nearly half of the dependencies, resulting in almost half of the dependencies not being extracted, which would lead to a very incomplete dependency graph. After continuous attempts, I discovered that newer versions of JDT could resolve most of the bindings. The final JDT version (Maven dependencies) I used is:
<dependency>
  <groupId>org.eclipse.core</groupId>
  <artifactId>org.eclipse.core.runtime</artifactId>
  <version>3.7.0</version>
</dependency>
<dependency>
  <groupId>org.eclipse.core</groupId>
  <artifactId>org.eclipse.core.resources</artifactId>
  <version>3.7.100</version>
</dependency>
<dependency>
  <groupId>org.eclipse.tycho</groupId>
  <artifactId>org.eclipse.jdt.core</artifactId>
  <version>3.12.2.v20161117-1814</version>
</dependency>
I couldn’t help but think that if I hadn’t used Maven but instead directly imported JAR files, even if I had suspected a version mismatch, I wouldn’t have been able to resolve it.
Dependency Graph
I modeled the dependency graph as a directed graph, with classes as nodes and dependencies as directed edges. This graph allows parallel edges to represent multiple calls between two classes but does not allow cycles, meaning calls from a class to itself are ignored. Additionally, dependencies on standard libraries and third-party libraries are excluded by default. The directed graph data structure uses Guava’s Network class, as described in Guava Graphs Explained.
Dependency Graph Visualization
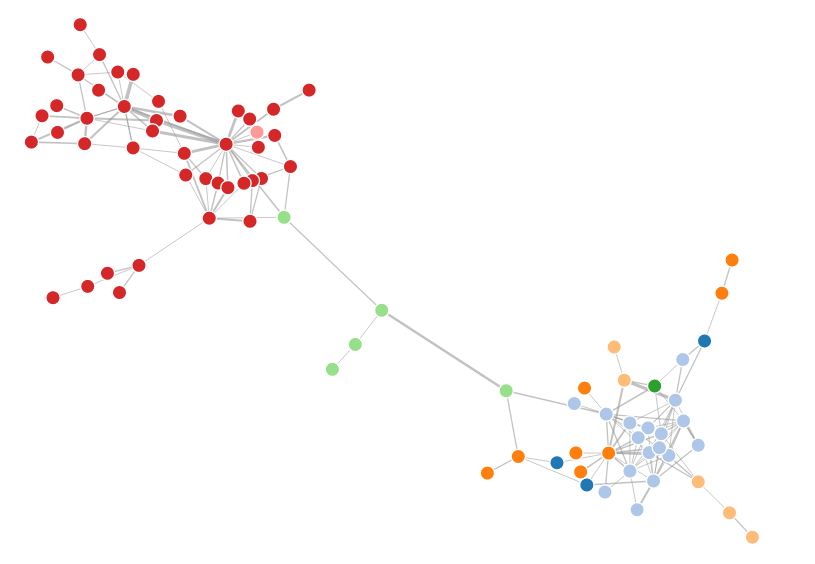
I chose a Force-directed Graph based on D3.js as the visualization method. The Neo4j database also uses this method for visualization. This graph displays nodes and edges using the concept of “forces,” where edges act like springs providing inward pull, and nodes act like charged particles repelling each other. This layout rearranges nodes to help reduce edge crossings in the graph. Furthermore, it is draggable, offering good interactivity. I converted the parallel edges in the original dependency graph into edge weights, so the more dependencies between two classes, the greater the weight and thus the stronger the pull between them.
When using this graph, be careful: if there is no dependency between two nodes, absolutely do not set an edge, not even with zero weight! I initially overlooked this, which resulted in all the edges getting tangled up like a ball of yarn, and I thought I had made a mistake somewhere in my graph.
The final dependency graph is shown below. You can try the drag-and-drop effect here.